Spark Profiler
Use Spark to diagnose and resolve performance issues on your Cafora server.
Check the version and permissions first
Run spark help in Console. Paper bundles spark starting with 1.21. For other server software or older releases, check for an existing compatible installation before adding a plugin. Follow the installed version’s help and permissions.
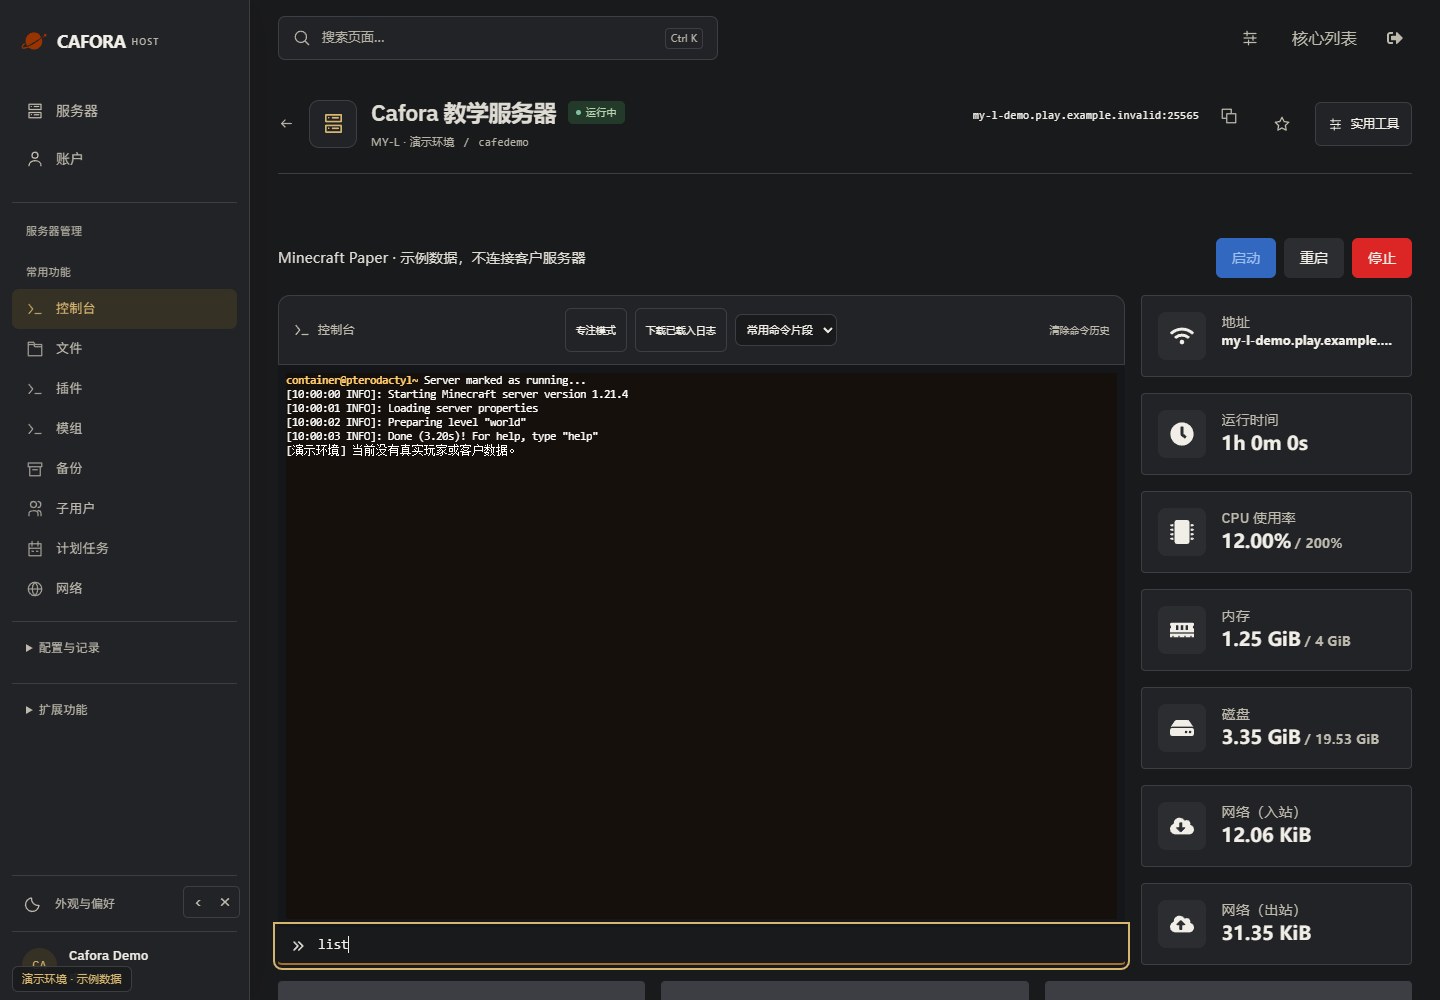
Examples below use Panel Console, without a leading /. Add / in game and use an account with the required permission. Proxy and client installations may use another prefix.
Profile while the problem occurs
spark profiler start --timeout 300This samples for five minutes. Use spark profiler stop to finish early or spark profiler info to inspect status. Some versions profile in the background by default, so check status before starting another session.
Reproduce the normal problematic activity and record player count, time and recent changes. An empty server or a sample collected after the incident may miss the cause.
Health reports and sharing
spark healthCurrent versions offer spark health upload for a static report. Inspect its contents before sharing the link with support and describe the problem. A report does not replace complete logs, and one snapshot cannot establish a leak.
Heap dumps and allocation profiling are further diagnostic steps. They can add overhead and contain runtime data; arrange them with support according to available space and maintenance time.
References: spark command documentation, Paper profiling guide. See the Console guide for the illustrated walkthrough.