Resource Usage
Monitor your server's CPU, RAM, and storage usage on Cafora Host.
Find the live graphs
Actual screenshot; labels depend on the selected interface language. Click the image to view it at full size.
Open 控制台 / Console and scroll below the log. The graphs show CPU 使用率 / CPU, 内存 / Memory, and 网络 / Network. The resource cards also show disk usage and your limits. Watch the graph while reproducing the issue and record its time.
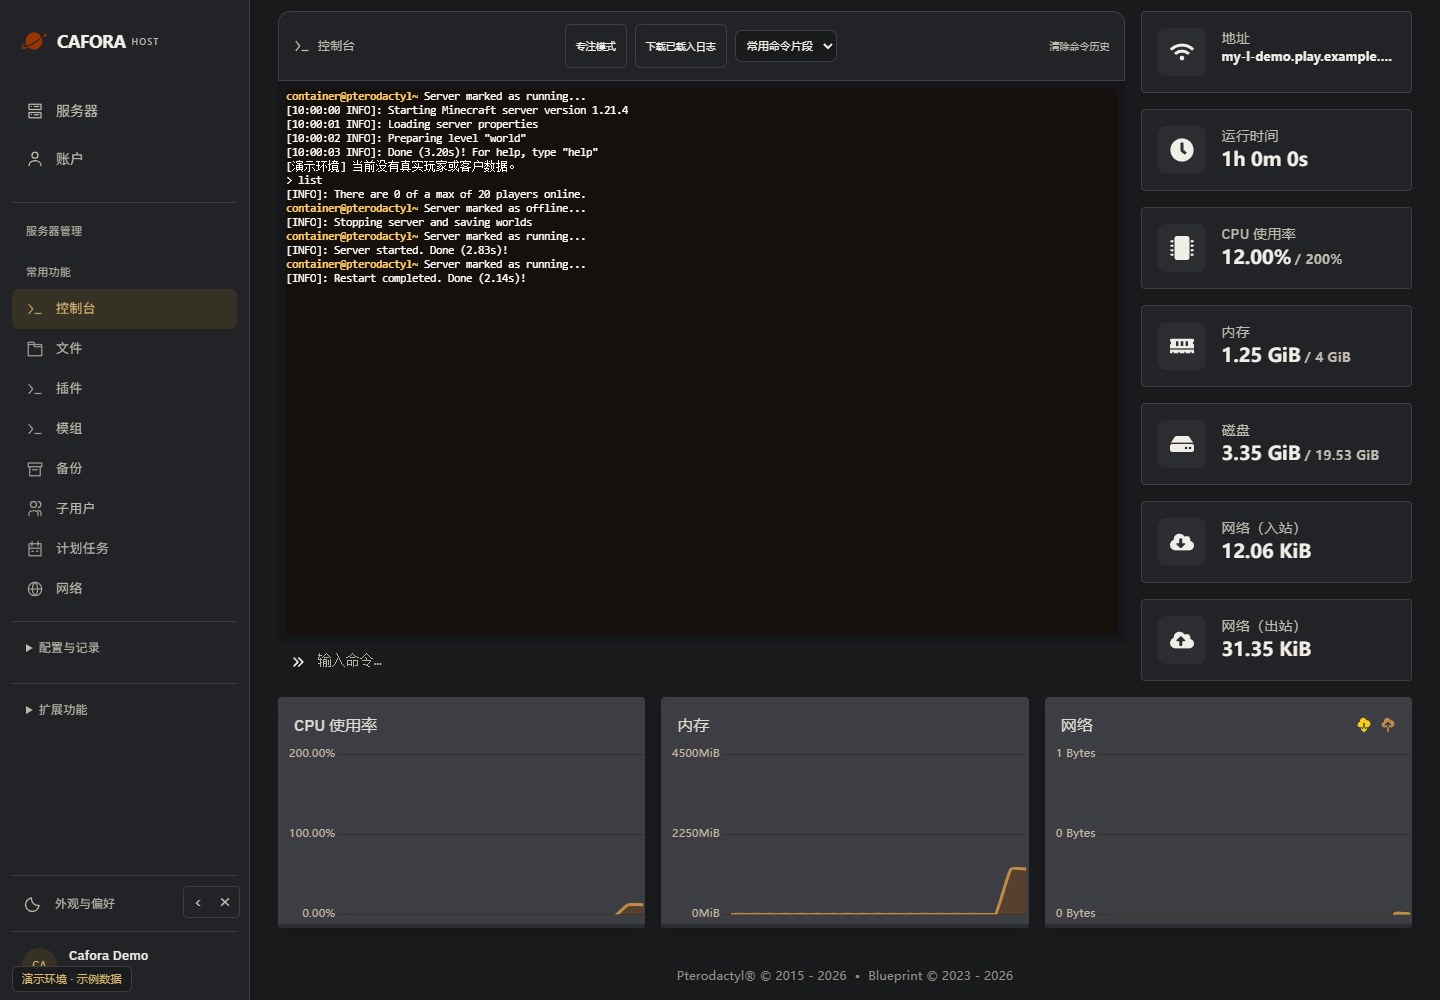
Panel CPU is aggregate process usage: approximately 100% means one logical CPU’s worth of time; it is not a percentage of the full host. A busy Minecraft main thread can lower TPS while the total stays below a multi-CPU quota. These graphs do not measure packet loss, network route quality, TPS or per-plugin cost. For support, include the time zone, TPS/MSPT if available, recent errors and what players were doing.
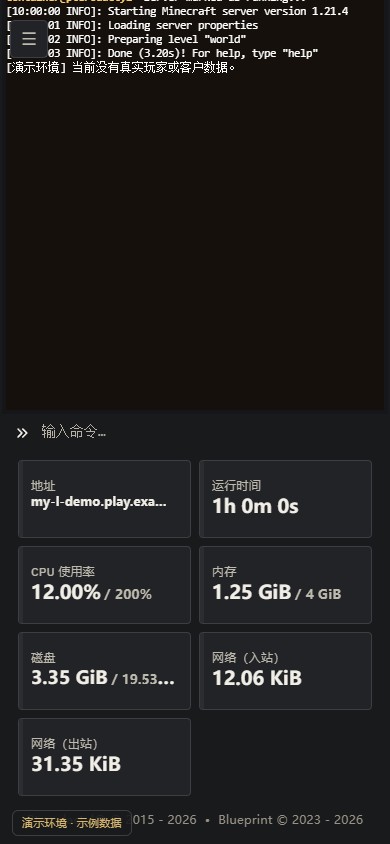
Resource cards on mobile and in focus mode
The console should show resource cards on phones and tablets, including in focus mode. Scroll down to inspect the graphs, leave focus mode if helpful, and confirm that you selected the correct server. If cards are still missing after an update, refresh the page. If the problem remains, send support a screenshot, device/browser details and the time it happened.
Usage, limits and free space
Memory and disk limits are the maximum allowed by your plan; usage is what the service currently consumes. A disk limit is not the node's remaining free space. Free space on a node does not let you raise your own plan's allocation. Back up before deleting files and contact support about quota changes.
Panel installation, runtime and Store payment status are independent. A newly connected CPU/network graph may have little history. Zero usage alone does not establish activation, payment or readiness. Check console output together with the Store service status.